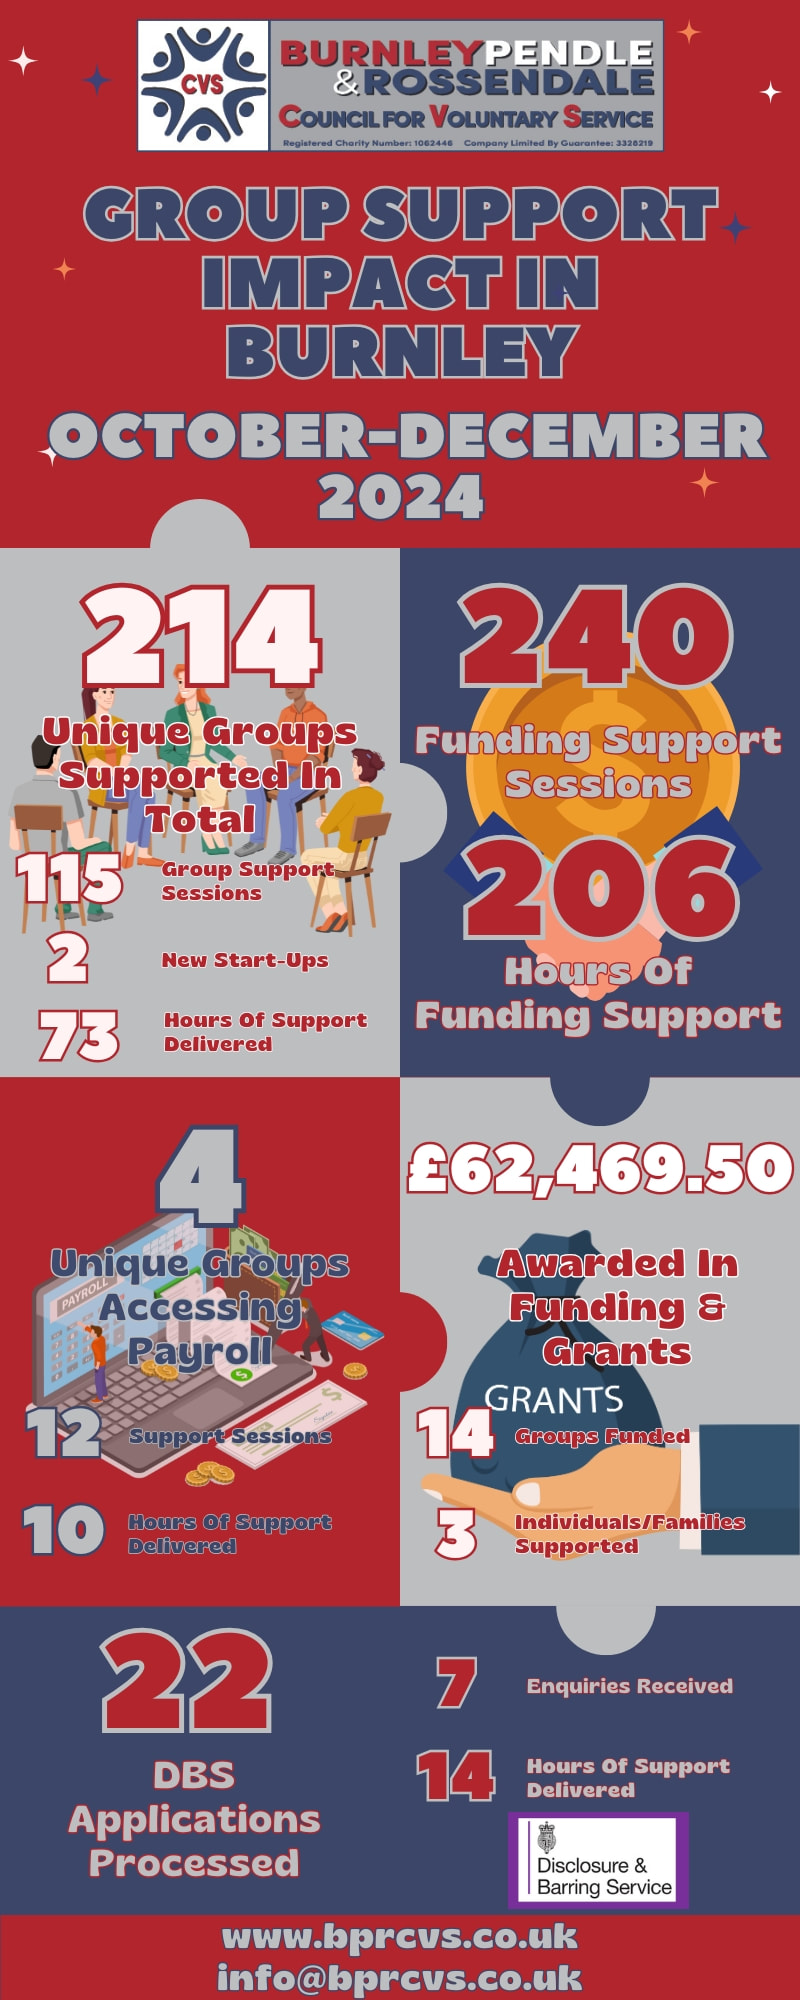
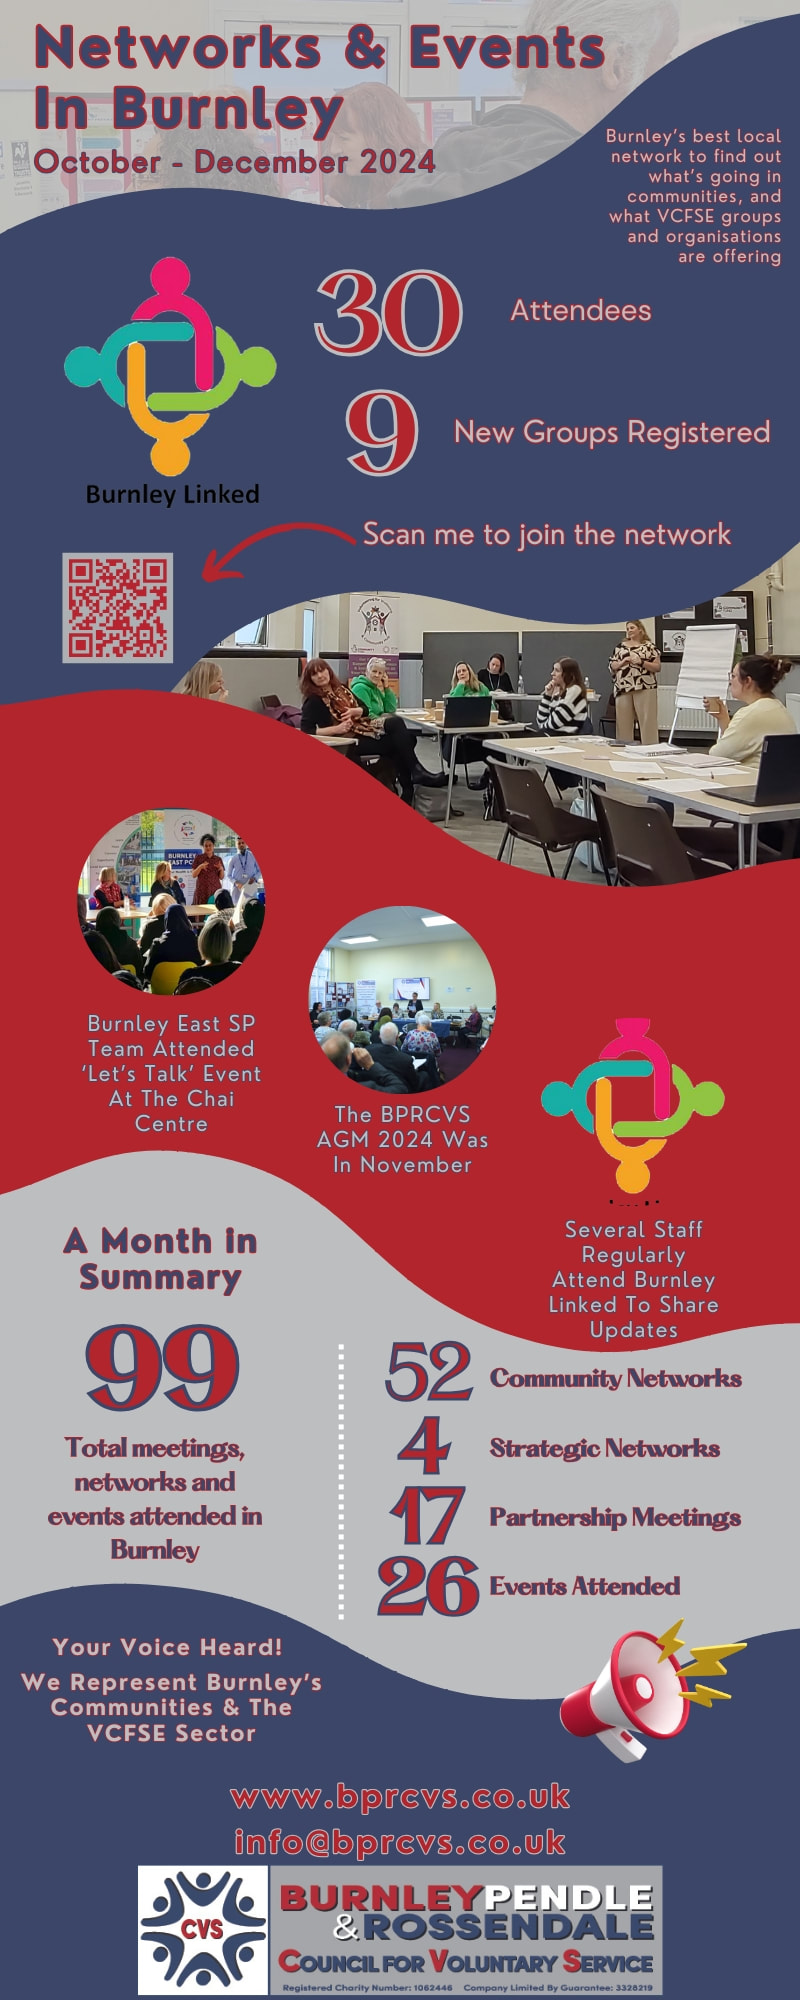
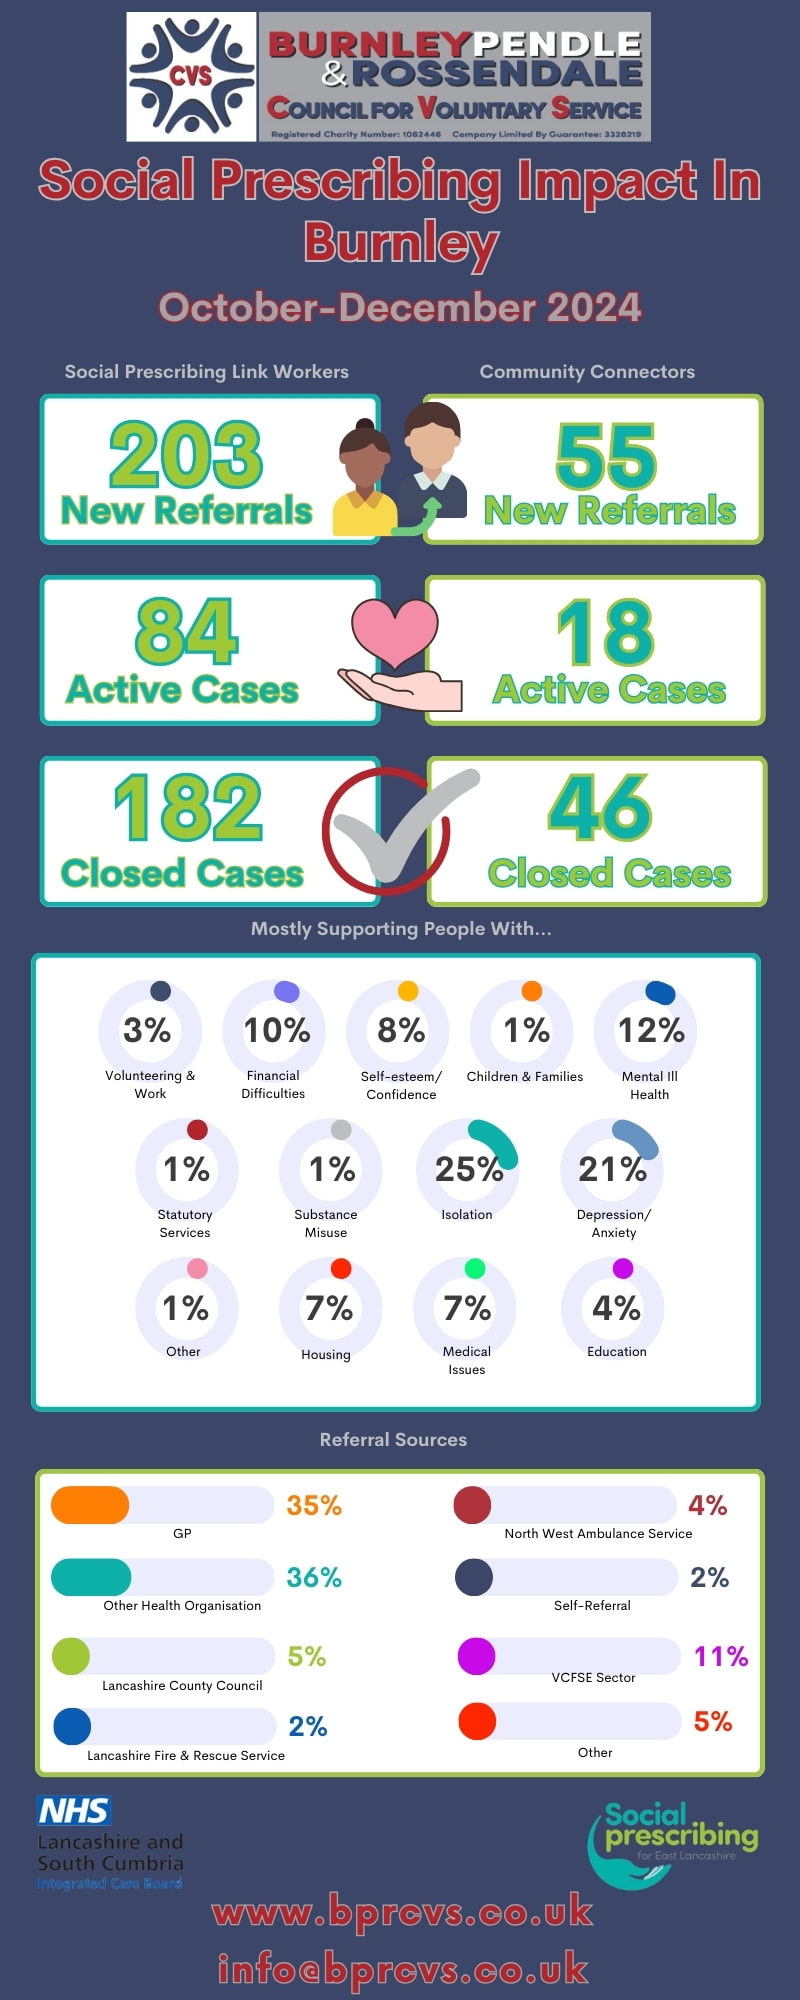
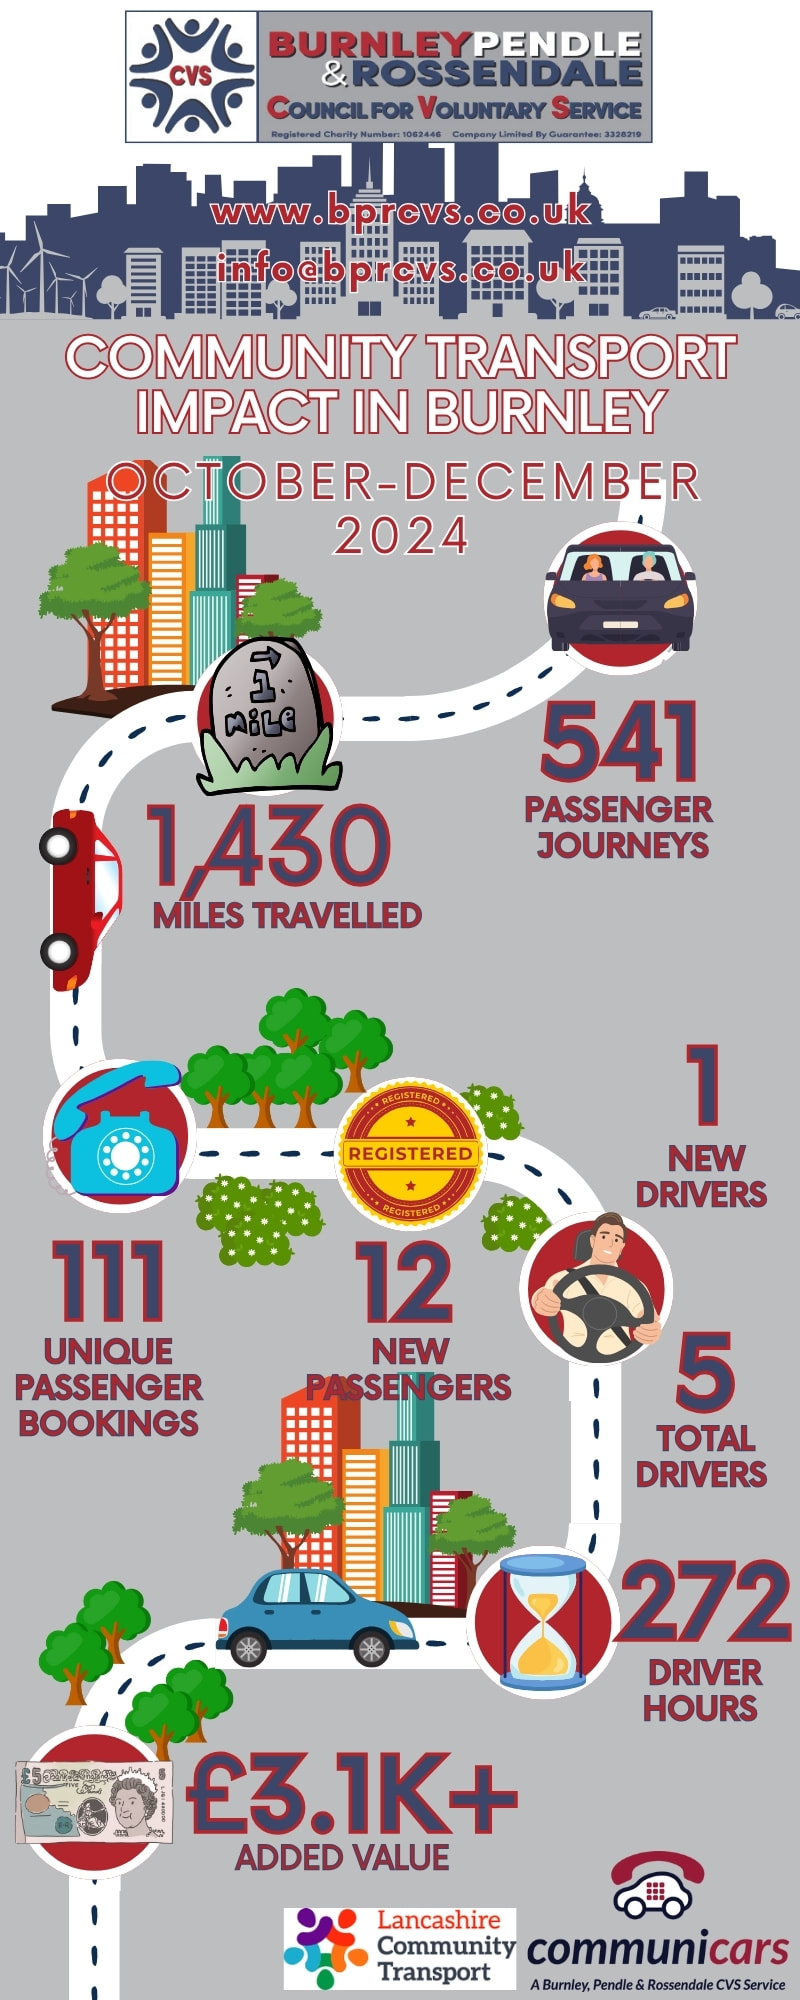
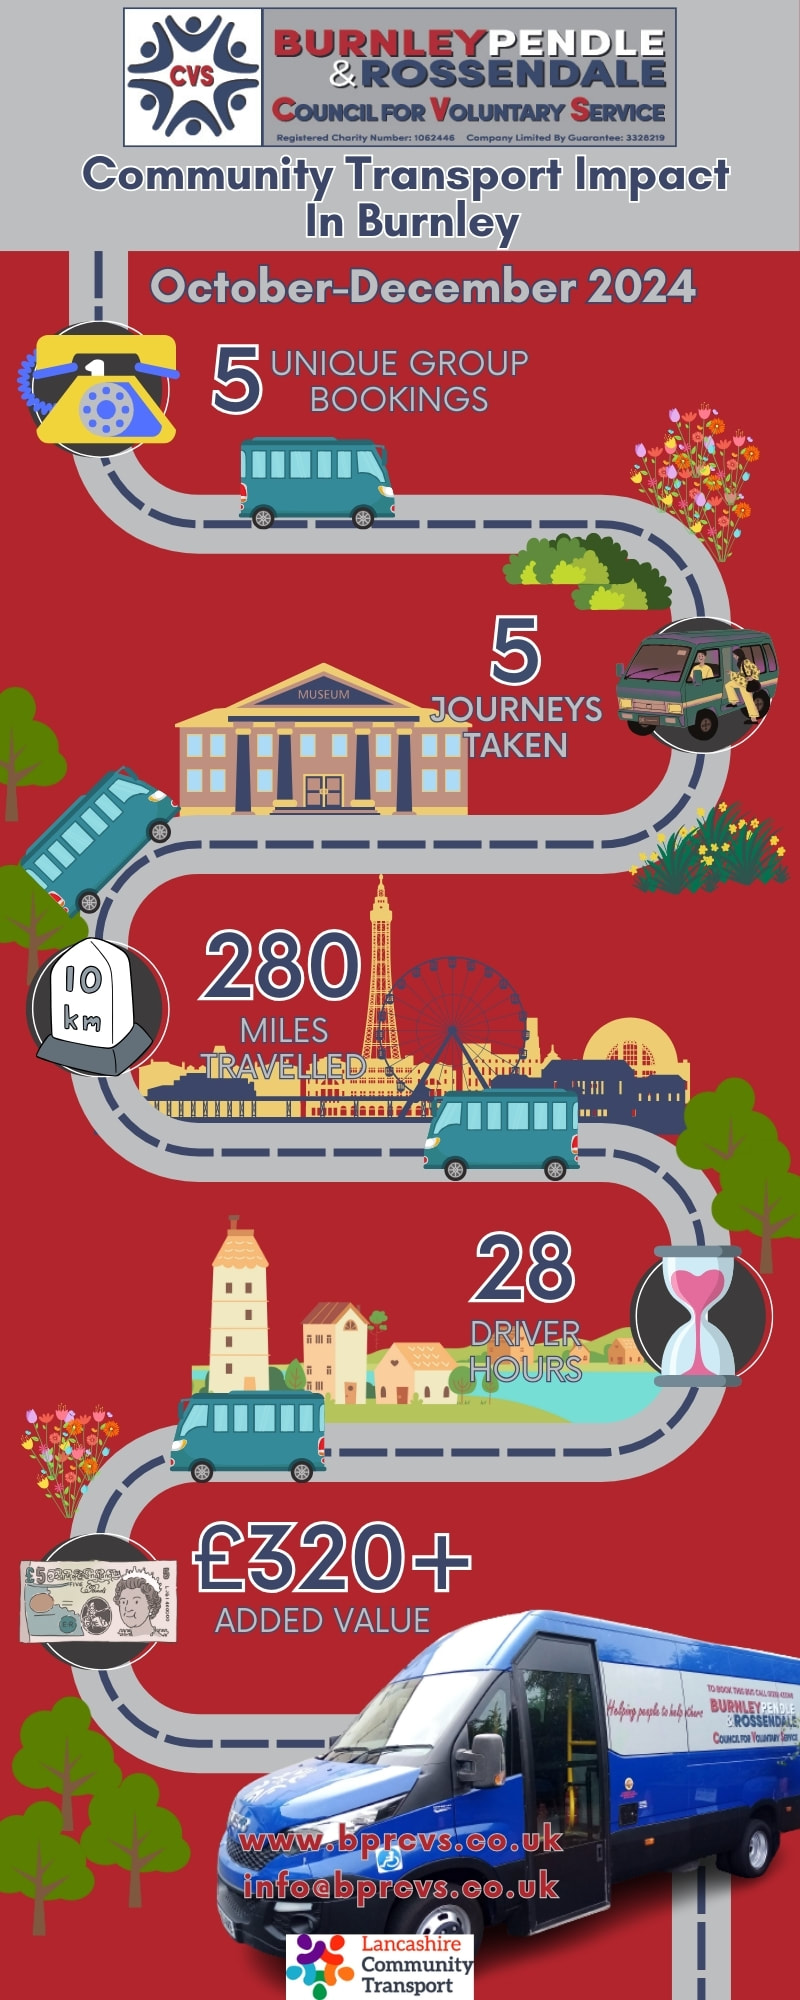
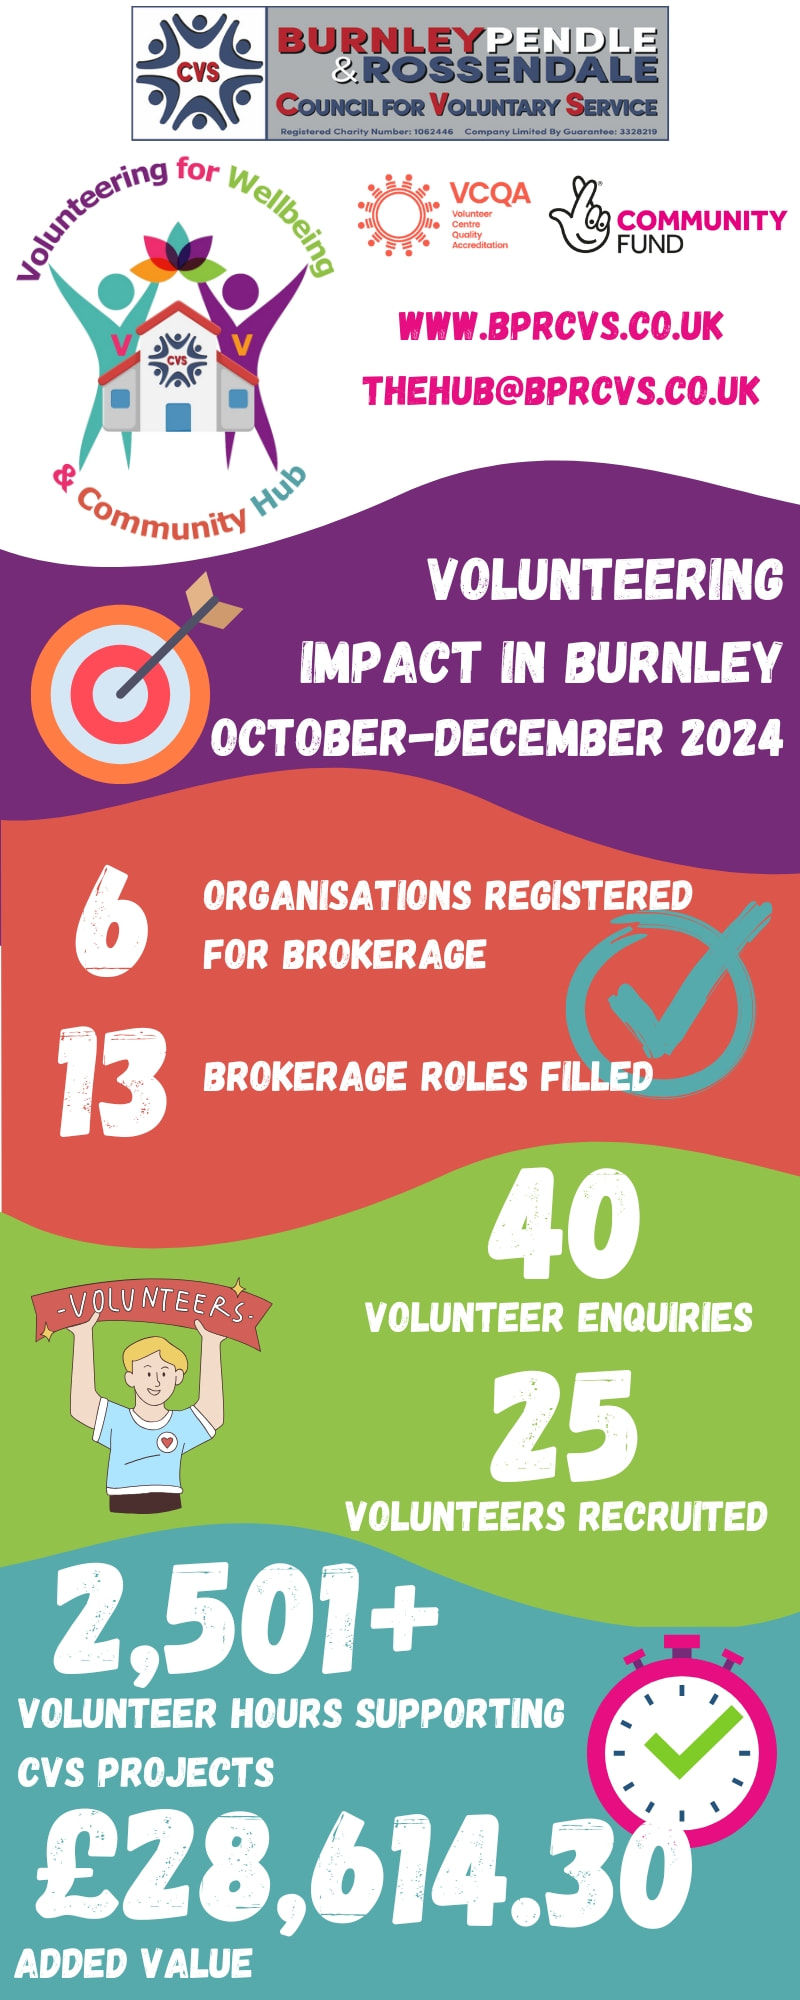
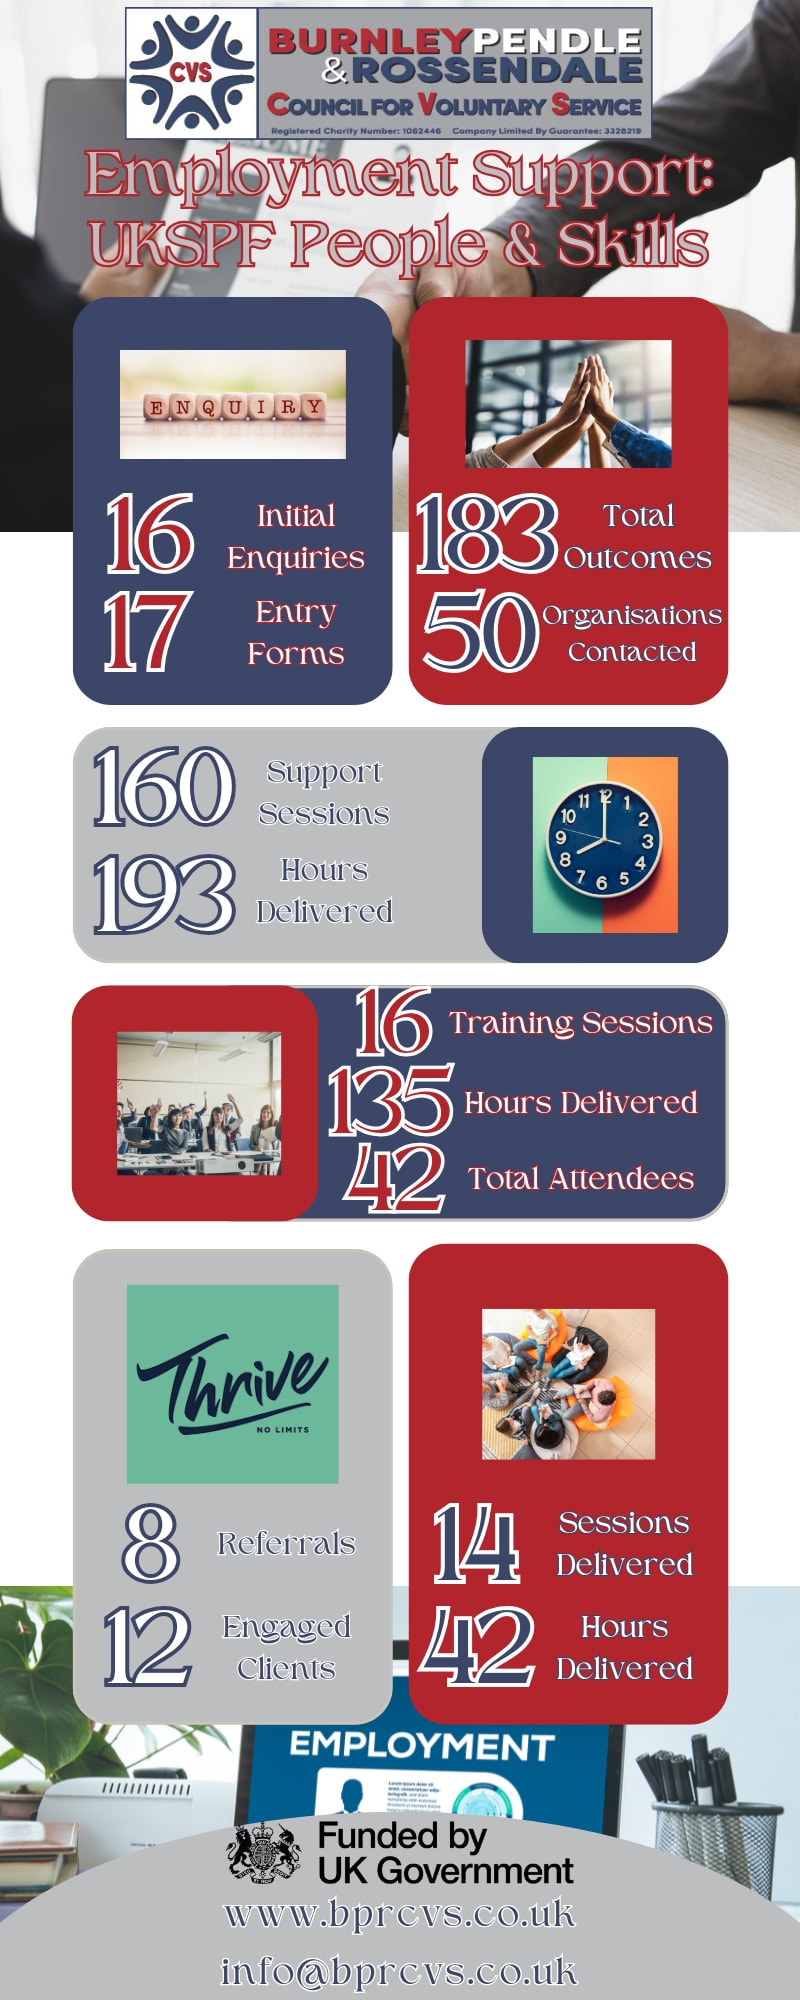
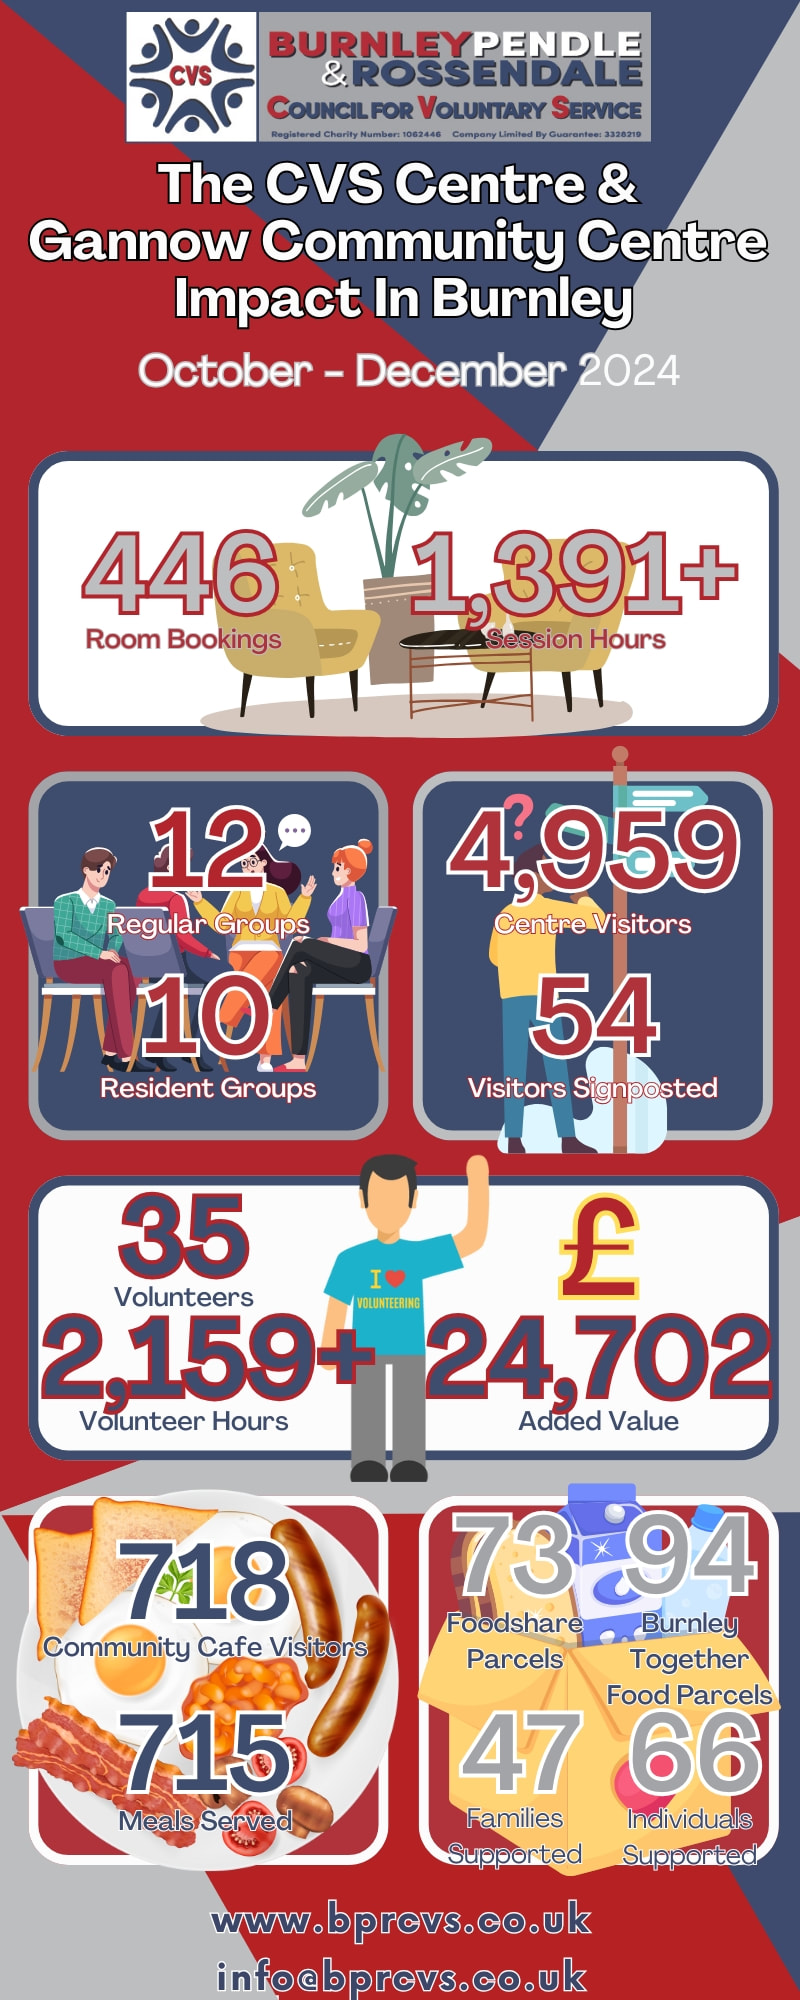
 To further showcase our impact in Burnley we have created a range of infographics which display the key performance statistics for the period of October to December 2024. All projects and services running in the Burnley area have a dedicated infographic. Click 'Read More' below to access the infographics. Check out the infographics in more detail by clicking on each one to open an enlarged version.
Don't forget to check out our impact in Pendle and Rossendale too!
You can also watch a short video version of our locality impact report for Burnley or download a pdf copy to keep and share with others. We've also got our comprehensive quarterly impact report which covers all projects and services across all localities including the wider Lancashire area. This report contains much more including case studies, feedback and compliments, and other information. Visit the 'Our Impact' page to find the most recent report and previous versions too.
0 Comments
Your comment will be posted after it is approved.
Leave a Reply. |
AuthorWrite something about yourself. No need to be fancy, just an overview. Archives
August 2025
Categories |

 RSS Feed